
Nhận định phân tích
Bản phân tích tài chính cho XAUUSD từ Horus Signal cho thời gian dữ liệu nến: M15: ngày 19 tháng 03 đến ngày 04 tháng 06 năm 2026; H1: ngày 04 tháng 08 năm 2025 đến ngày 04 tháng 06 năm 2026.
BÁO CÁO PHÂN TÍCH KỸ THUẬT XAUUSD ĐA KHUNG THỜI GIAN
1. Tổng quan đồng thuận đa khung thời gian
Việc kết hợp nhiều khung thời gian (M15, H1) cùng các chân trời phân tích dài hạn
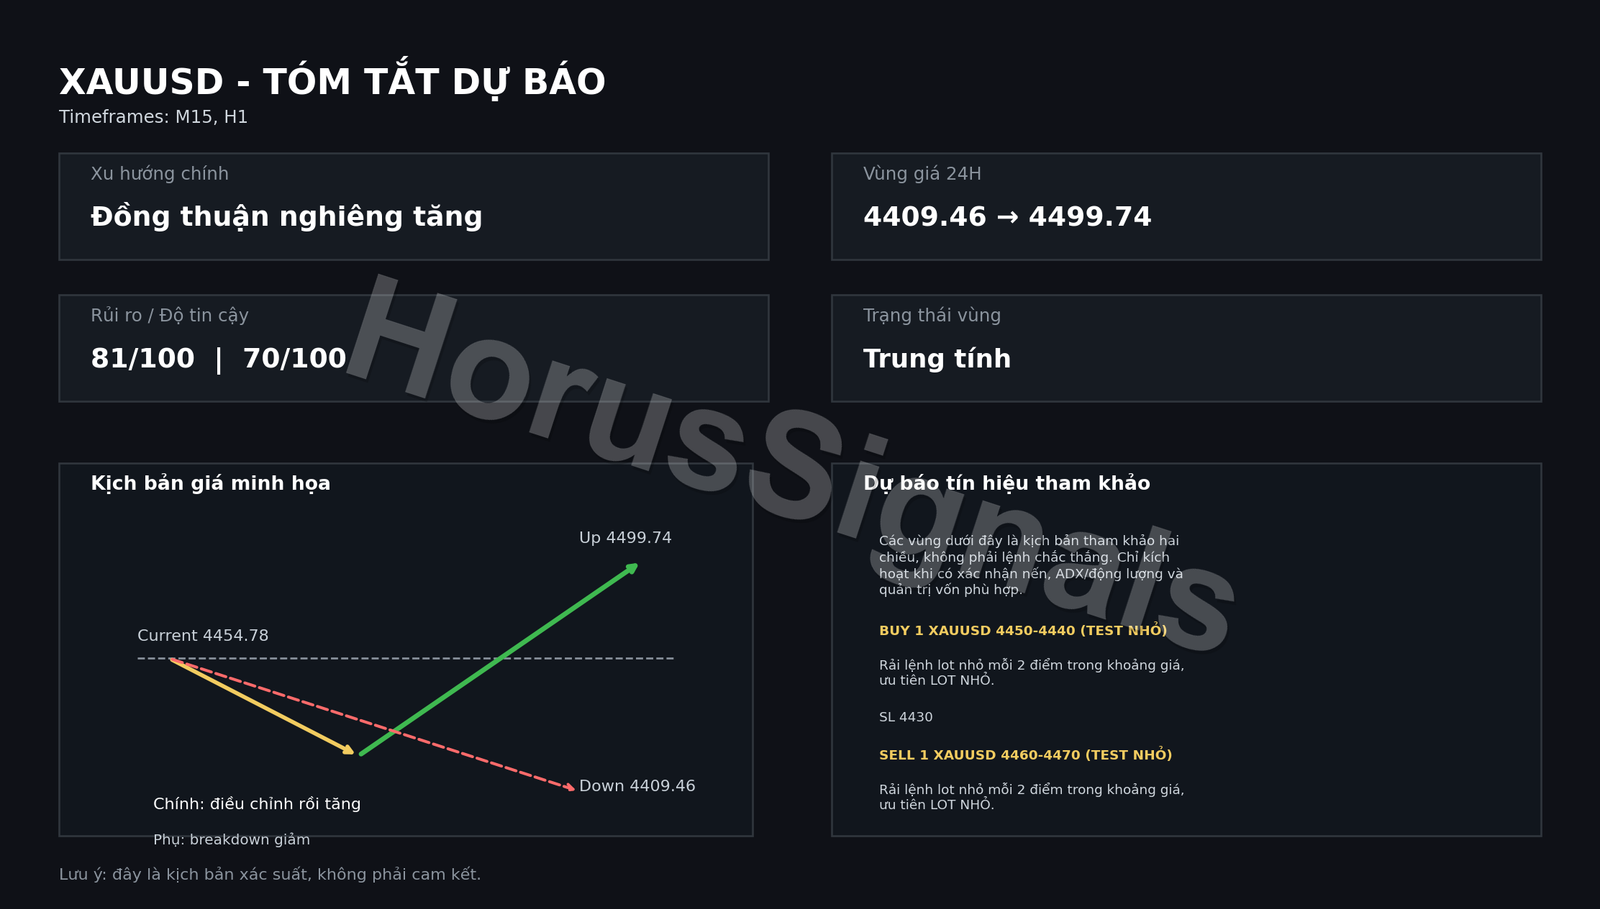
Dự báo tín hiệu tham khảo
Các vùng dưới đây là kịch bản tham khảo hai chiều, không phải lệnh chắc thắng. Chỉ kích hoạt khi có xác nhận nến, ADX/động lượng và quản trị vốn phù hợp.
🏅 BUY 1 XAUUSD 4450-4440 (TEST NHỎ)
👉 Rải lệnh lot nhỏ mỗi 2 điểm trong khoảng giá, ưu tiên LOT NHỎ.
👉 SL 4430
🏅 BUY 2 XAUUSD 4430-4420
👉 Rải lệnh lot nhỏ mỗi 2 điểm trong khoảng giá, ưu tiên LOT NHỎ.
👉 SL 4410
🏅 BUY 3 XAUUSD 4420-4410
👉 Rải lệnh lot nhỏ mỗi 2 điểm trong khoảng giá, ưu tiên LOT NHỎ.
👉 SL 4400
🏅 SELL 1 XAUUSD 4460-4470 (TEST NHỎ)
👉 Rải lệnh lot nhỏ mỗi 2 điểm trong khoảng giá, ưu tiên LOT NHỎ.
👉 SL 4480
🏅 SELL 2 XAUUSD 4480-4490
👉 Rải lệnh lot nhỏ mỗi 2 điểm trong khoảng giá, ưu tiên LOT NHỎ.
👉 SL 4500
🏅 SELL 3 XAUUSD 4490-4500
👉 Rải lệnh lot nhỏ mỗi 2 điểm trong khoảng giá, ưu tiên LOT NHỎ.
👉 SL 4510
🚩 🚩 CHIẾN LƯỢC CÓ THỂ THAY ĐỔI THEO PHIÊN GIAO DỊCH: Phiên Sydney (Úc) + Phiên Tokyo (Châu Á). Luôn giảm lot khi biến động mạnh và chờ xác nhận nến/ADX trước khi vào lệnh.
Cảm ơn bạn đã lắng nghe Bản phân tích tài chính cho XAUUSD từ Horus Signal. Chúc bạn bình tĩnh và giao dịch thành công.
Bảng đồng thuận đa khung thời gian
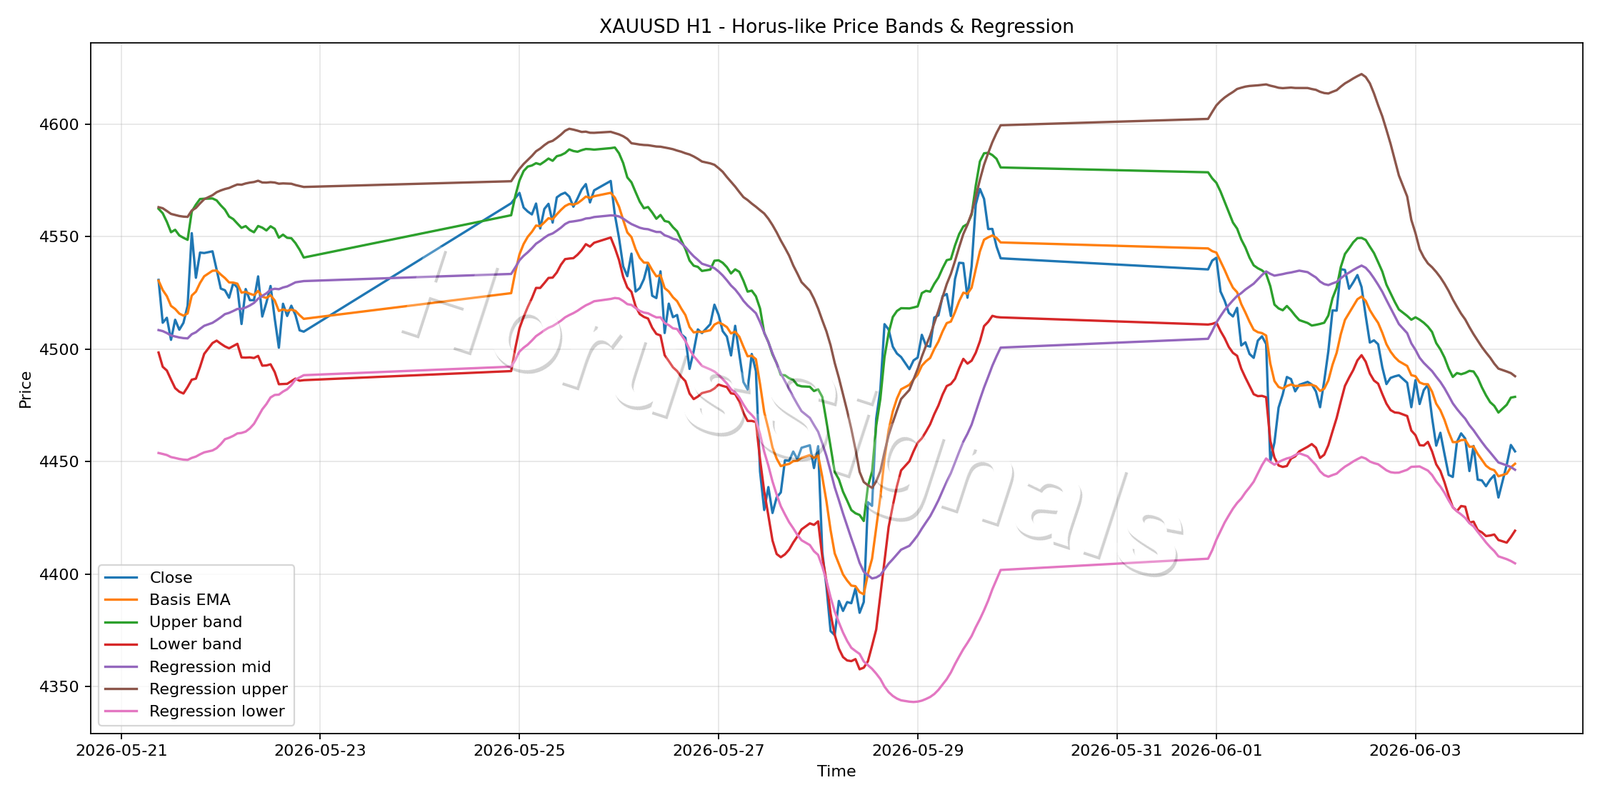
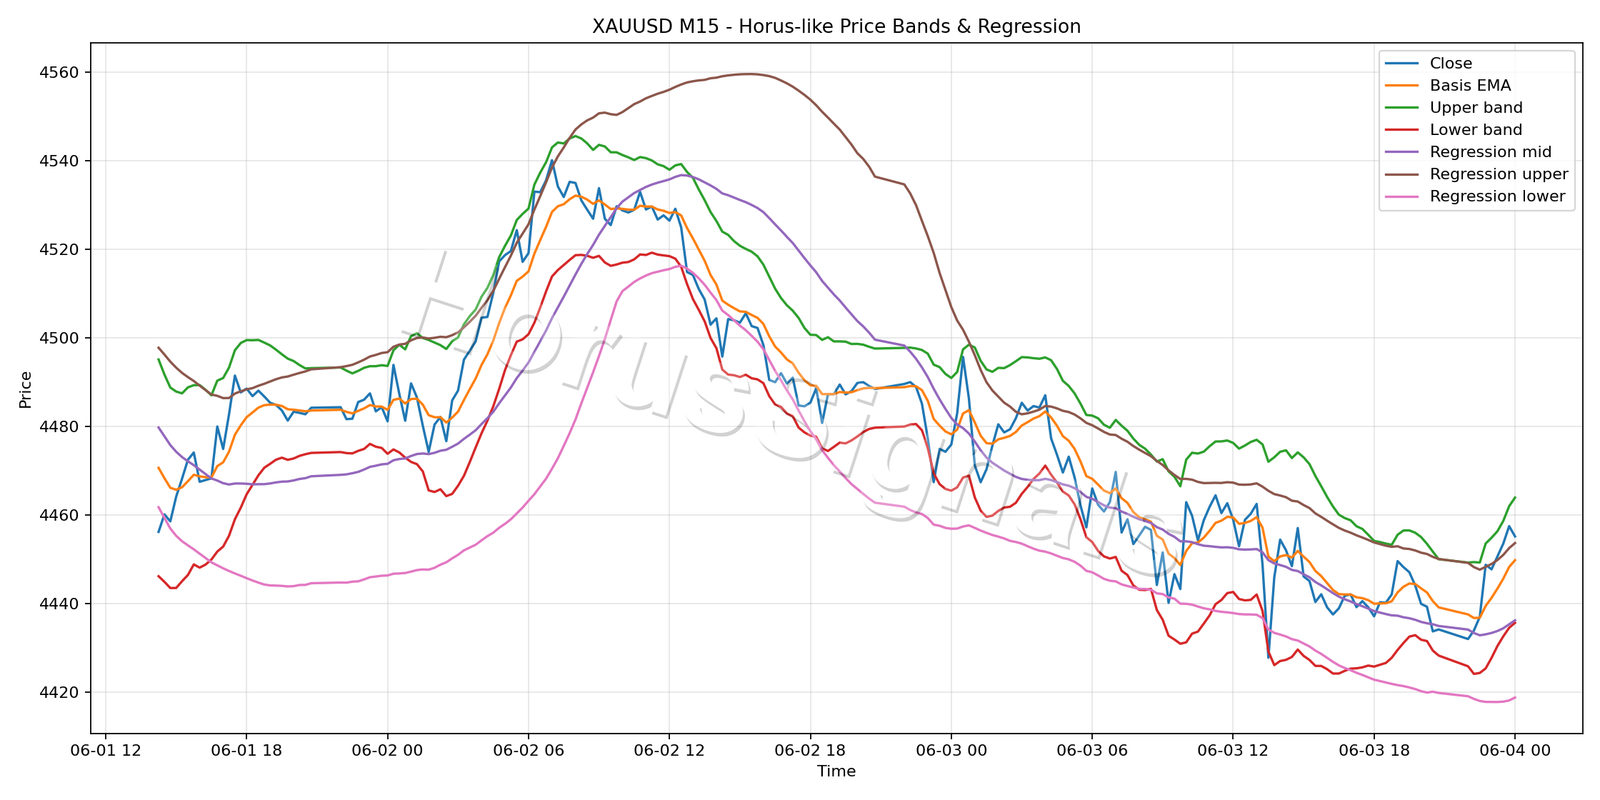
Kịch bản giá và vùng dự phóng
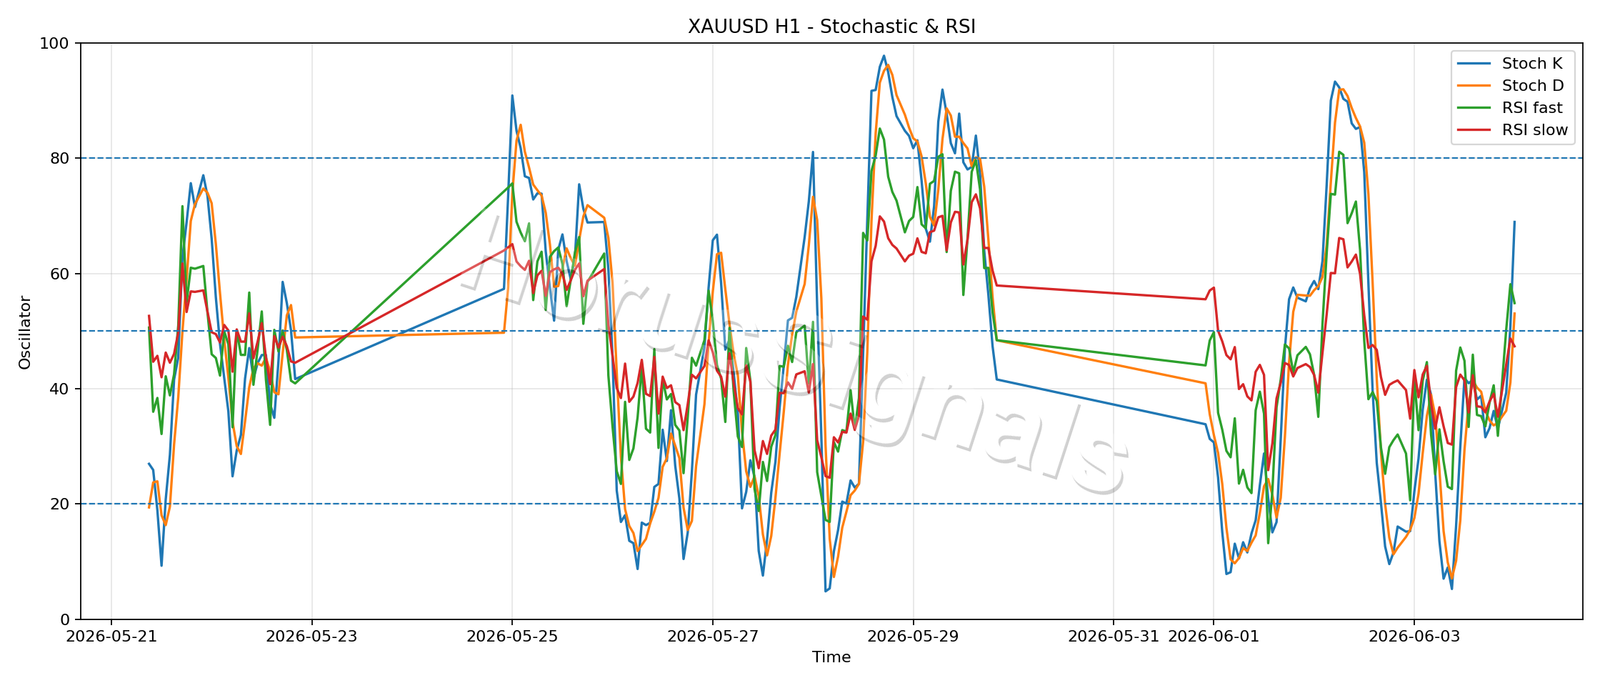
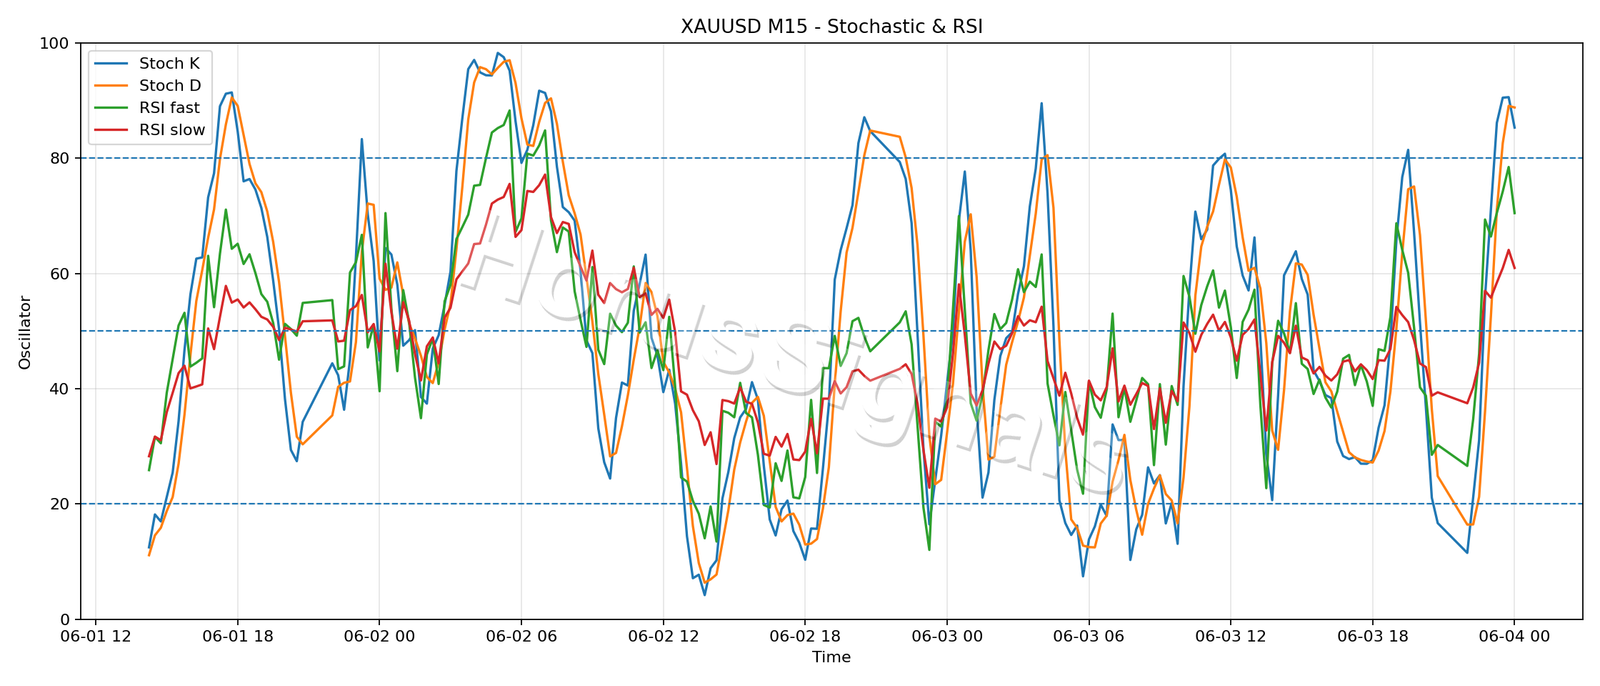
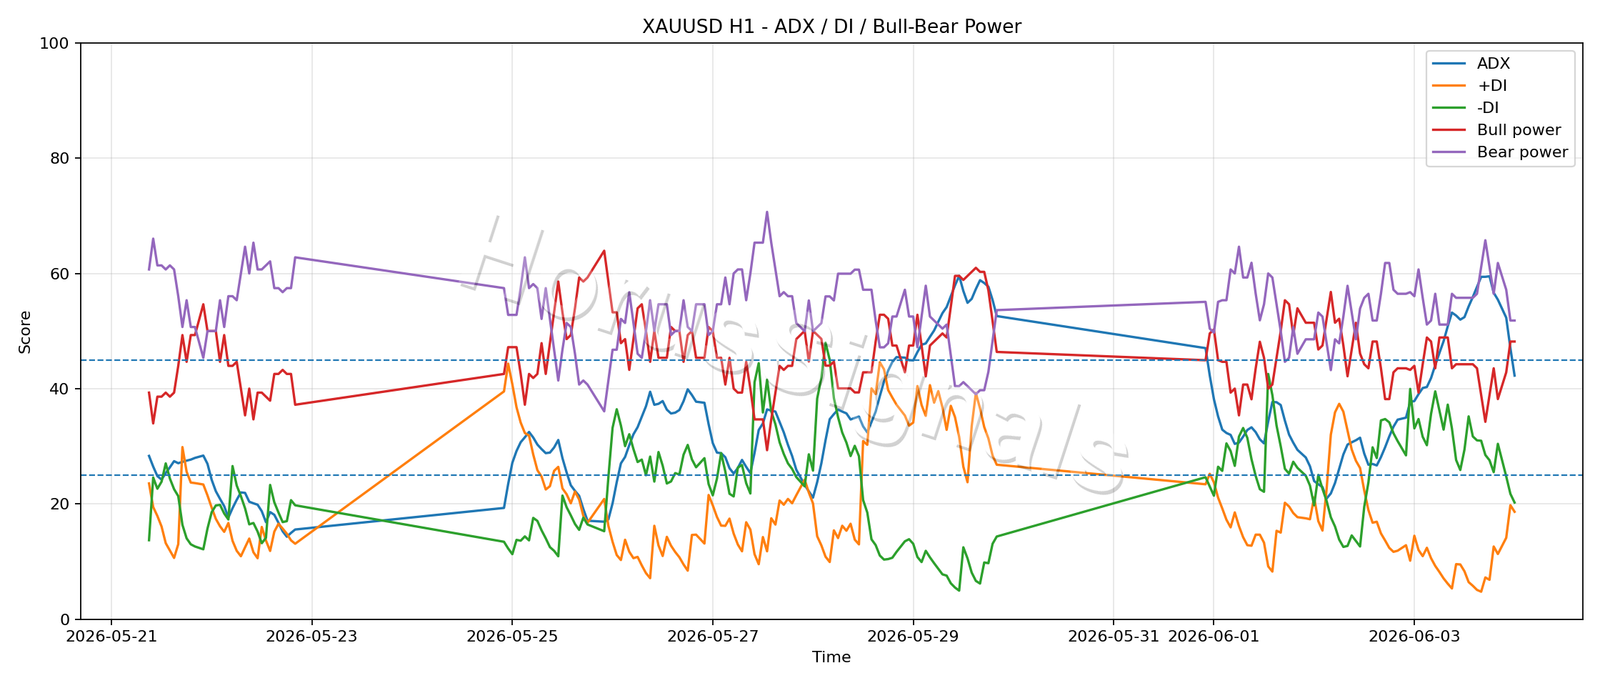
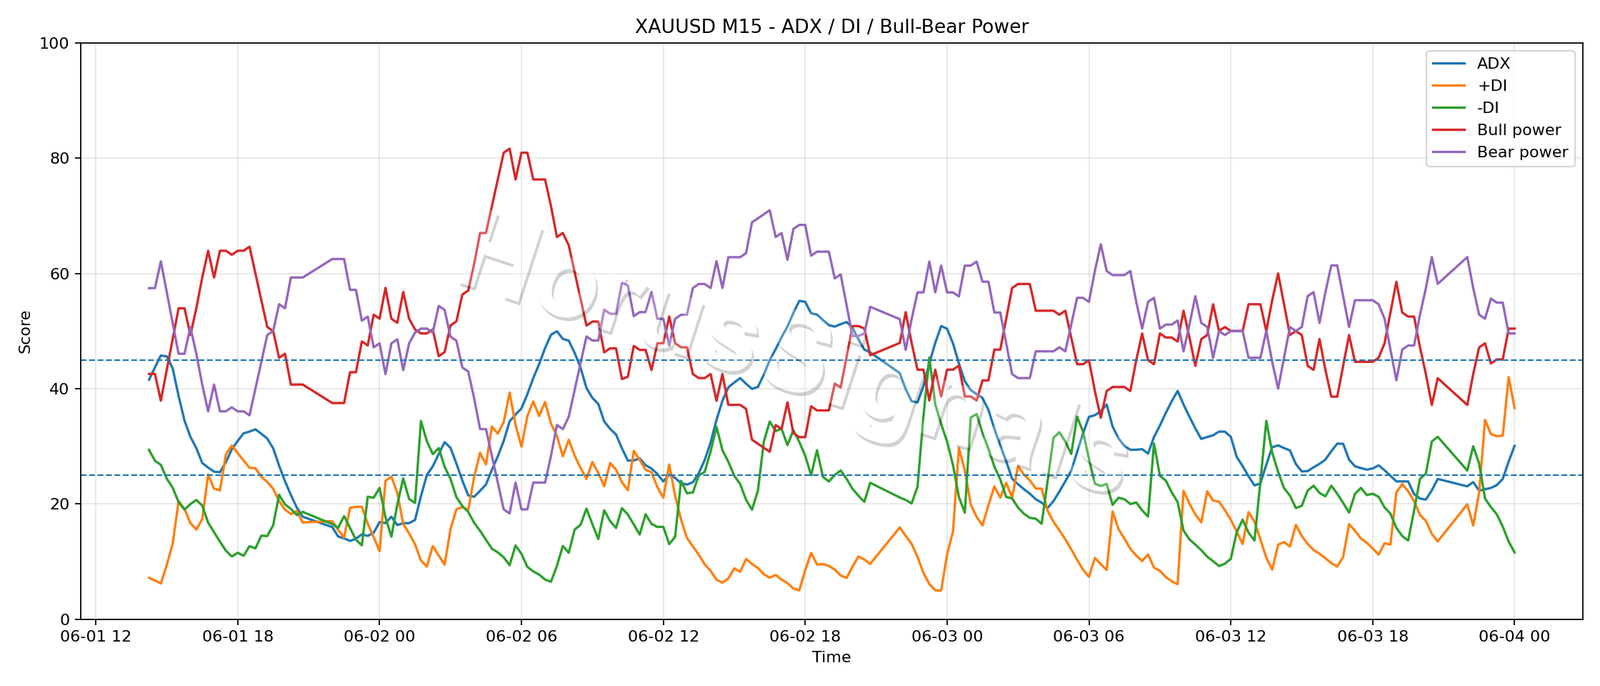
Chi tiết chỉ báo kỹ thuật
Analysis commentary
This is the financial analysis report for XAUUSD from Horus Signal, based on candle data for the following time range: M15: from March 19 to June 04, 2026; H1: from August 04, 2025 to June 04, 2026.
This is a multi-timeframe technical analysis report for XAUUSD. The analysis uses the following timeframes: M15, H1. This report is for reference only, not investment advice, and strict risk management remains essential.
General overview: combining multiple timeframes helps reduce noise from any single chart. When several timeframes point in the same direction, the scenario becomes more reliable. When they diverge, it is safer to wait for confirmation.
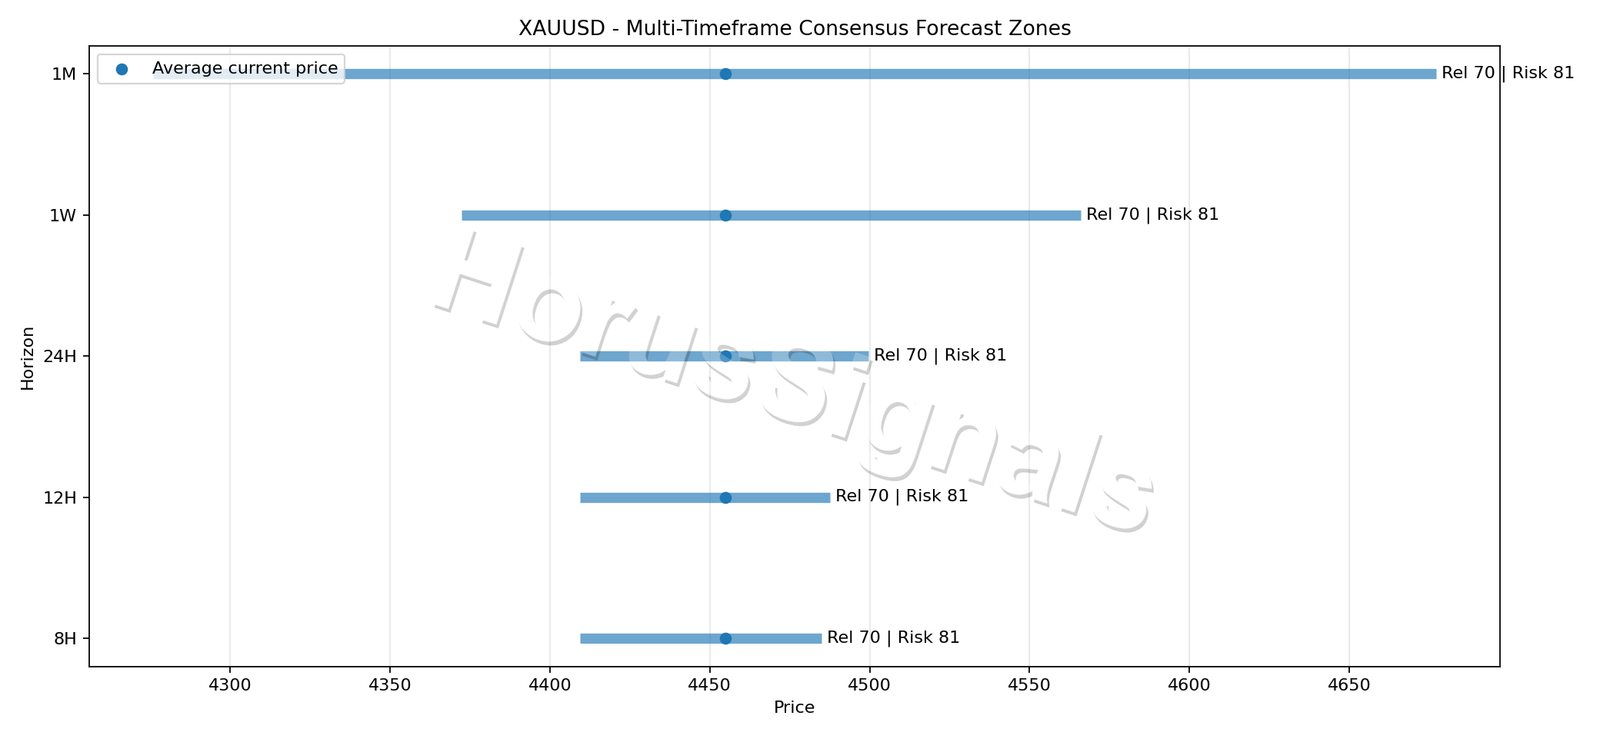
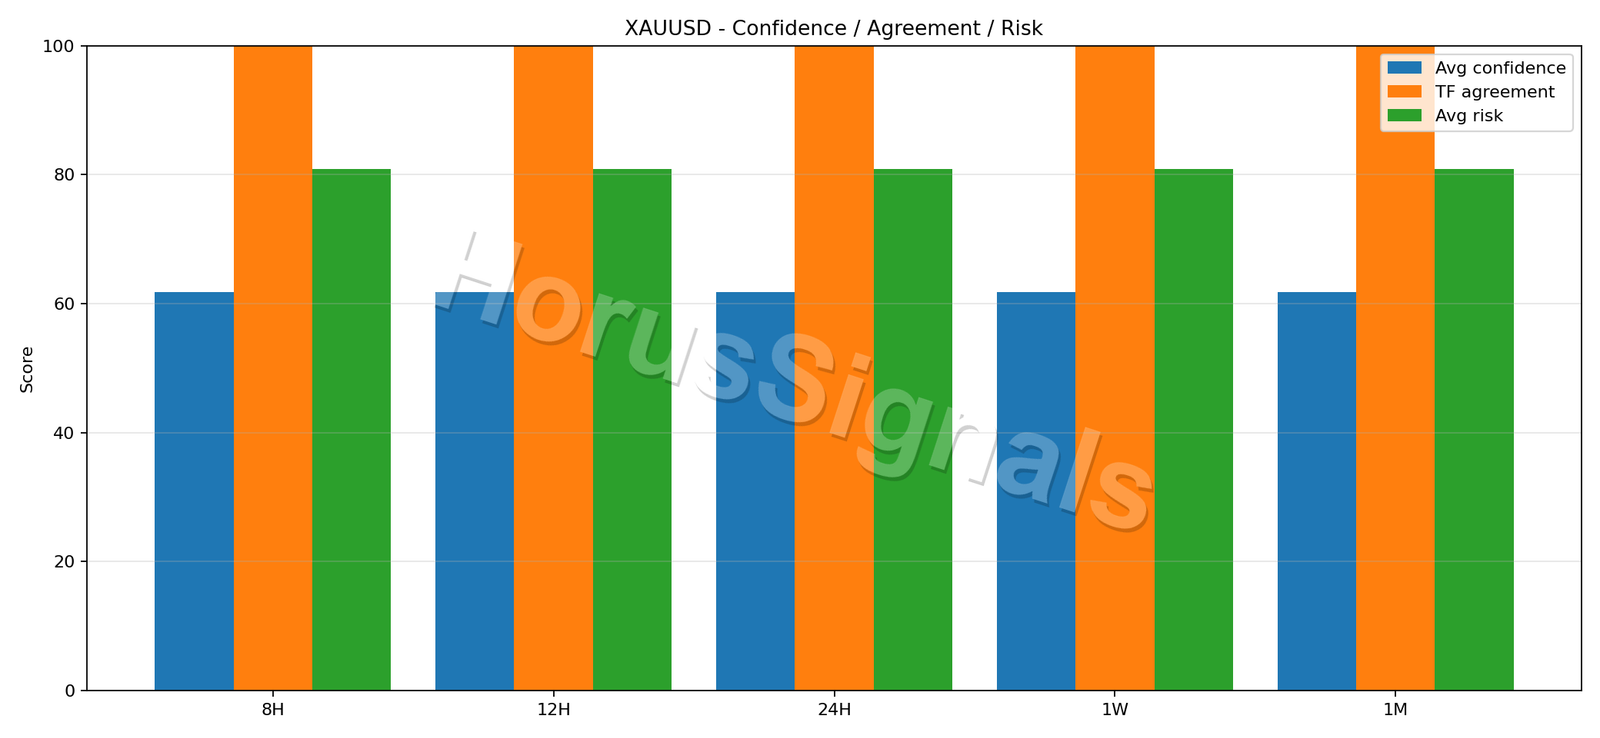
For the over the next 8 hours, the market shows a Consensus bullish bias. The expected price zone is between 4409.46 and 4485.01. The Horus zone state is Neutral. Average risk is 81/100, timeframe agreement is 100/100, and composite reliability is about 70/100. The current action bias is prefer long setups only after confirmation.
For the over the next 12 hours, the market shows a Consensus bullish bias. The expected price zone is between 4409.46 and 4487.53. The Horus zone state is Neutral. Average risk is 81/100, timeframe agreement is 100/100, and composite reliability is about 70/100. The current action bias is prefer long setups only after confirmation.
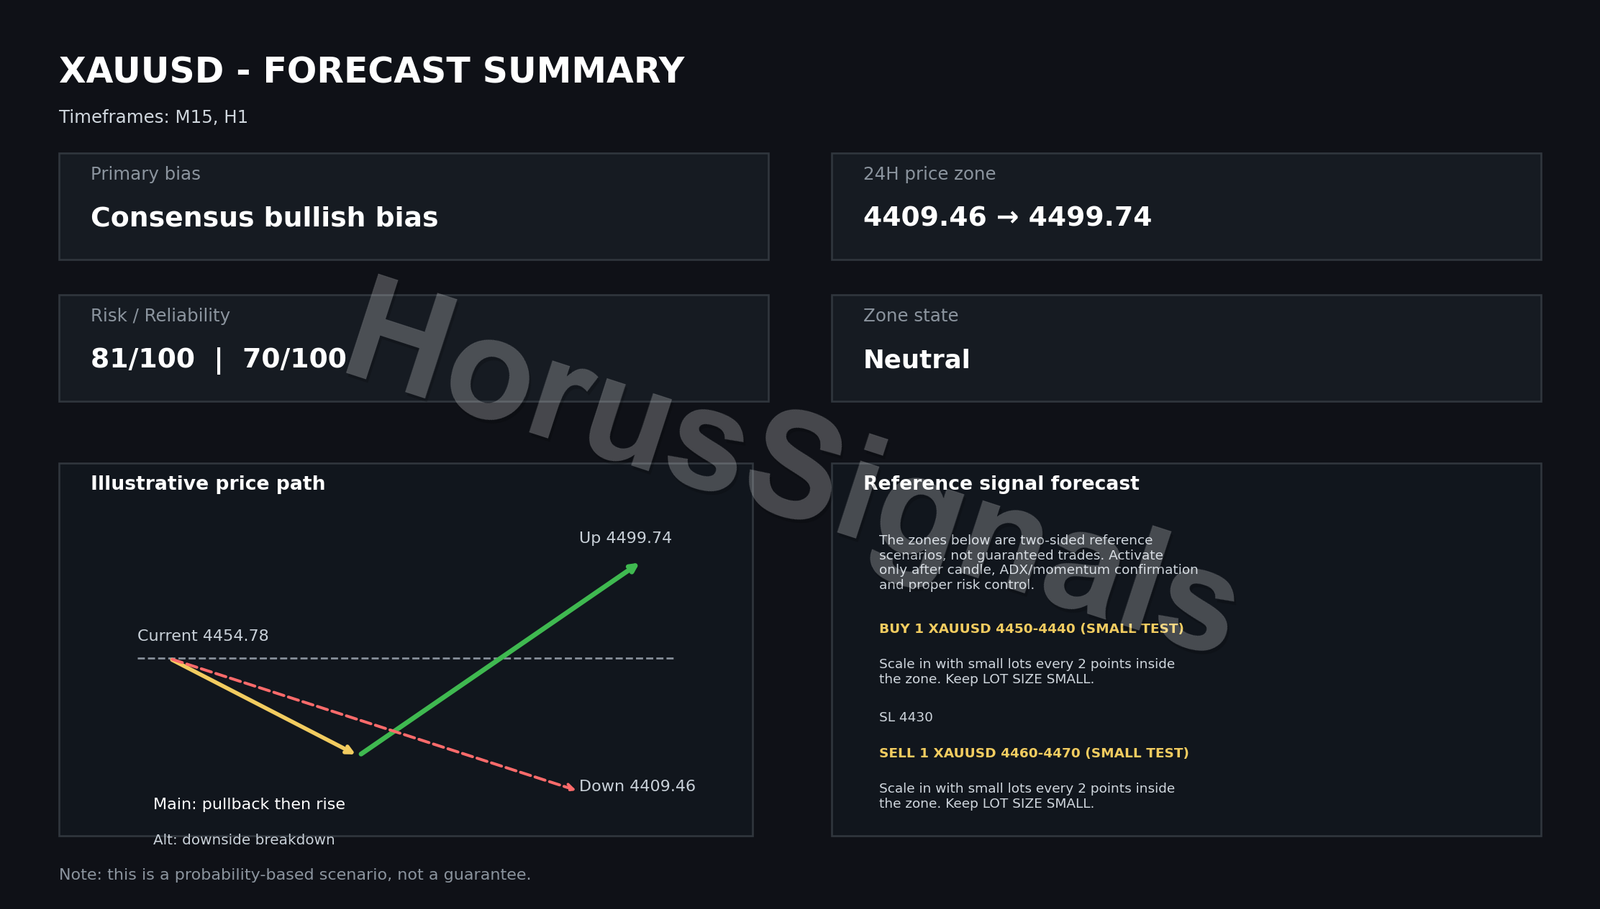
For the over the next 24 hours, the market shows a Consensus bullish bias. The expected price zone is between 4409.46 and 4499.74. The Horus zone state is Neutral. Average risk is 81/100, timeframe agreement is 100/100, and composite reliability is about 70/100. The current action bias is prefer long setups only after confirmation.
For the over the next 1 week, the market shows a Consensus bullish bias. The expected price zone is between 4372.26 and 4566.13. The Horus zone state is Neutral. Average risk is 81/100, timeframe agreement is 100/100, and composite reliability is about 70/100. The current action bias is prefer long setups only after confirmation.
For the over the next 1 month, the market shows a Consensus bullish bias. The expected price zone is between 4275.85 and 4677.20. The Horus zone state is Neutral. Average risk is 81/100, timeframe agreement is 100/100, and composite reliability is about 70/100. The current action bias is prefer long setups only after confirmation.
Action scenario: if price continues to follow the consensus direction and momentum confirms, traders may consider following the main bias. If price breaks the opposite zone or the agreement weakens, it is safer to reduce exposure or stay on the sidelines.
Conclusion: always place stop-loss beyond the nearest noise zone, avoid oversized positions in high-risk conditions, and refresh the analysis whenever the market structure changes.
Reference Trading Signal Forecast
The zones below are two-sided reference scenarios, not guaranteed trades. Activate only after candle, ADX/momentum confirmation and proper risk control.
🏅 BUY 1 XAUUSD 4450-4440 (SMALL TEST)
👉 Scale in with small lots every 2 points inside the zone. Keep LOT SIZE SMALL.
👉 SL 4430
🏅 BUY 2 XAUUSD 4430-4420
👉 Scale in with small lots every 2 points inside the zone. Keep LOT SIZE SMALL.
👉 SL 4410
🏅 BUY 3 XAUUSD 4420-4410
👉 Scale in with small lots every 2 points inside the zone. Keep LOT SIZE SMALL.
👉 SL 4400
🏅 SELL 1 XAUUSD 4460-4470 (SMALL TEST)
👉 Scale in with small lots every 2 points inside the zone. Keep LOT SIZE SMALL.
👉 SL 4480
🏅 SELL 2 XAUUSD 4480-4490
👉 Scale in with small lots every 2 points inside the zone. Keep LOT SIZE SMALL.
👉 SL 4500
🏅 SELL 3 XAUUSD 4490-4500
👉 Scale in with small lots every 2 points inside the zone. Keep LOT SIZE SMALL.
👉 SL 4510
🚩 🚩 STRATEGY MAY CHANGE BY TRADING SESSION: Sydney session + Tokyo session. Reduce lot size during high volatility and wait for candle/ADX confirmation before entry.
Thank you for listening to the financial analysis report for XAUUSD from Horus Signal. We wish you a calm mindset and successful trading.
Multi-timeframe consensus
Price scenario and forecast zones
Technical indicator details
